Sabtu, 29 September 2012

ARCView

ArcView
ArcView

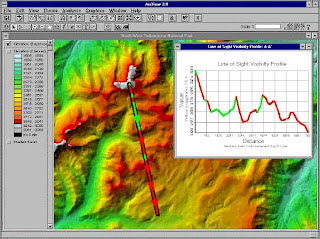
ArcView is one geographic information system software (GIS) created by ESRI (Environmental Systems Research Intitute). ArcView can perform data exchange, mathematical operations, spatial and attribute information displays simultaneously, create thematic maps, providing programming language (script), and perform other special functions with the help of extensions.
ArcView Shapefile format can be read, but it can keep calling ArcView data format BSQ, BIL, BIP, JPEG, TIFF, BMP, GeoTIFF or grid data from ARC / INFO and many other data. Each spatial data called will appear as a Theme and a combination of theme-theme will appear in a view. ArcView organize the components of the program (view, themes, tables, charts, layouts, and scripts) in a project. Project is an organizational unit of the highest in the ArcView.


ArcView 8.x and 9.x are part of the ArcGIS Desktop software suite. All components are installed on the system, with only those that are licensed being made functional. The current version of ArcView sold by Esri is 10.


Download software:
http://www.esri.com/products

Download for free (copy this link to browser) :
http://www.4shared.com/zip/Nk2G6gCR/arcview_gis_33.html

Digitization


1. Digitizing concept
         is a way to describe the condition of the earth into a computer file. Digitized map data sources include:
      - Raster Image Data
a. Map Analog: manual data source that will use additional tools that diditasi digitizing table.
digitalize table
digitalize table
b. Image Remote Sensing (Soft Data): such as remote sensing from satellites
c. Image Scanning (soft data): shaped scanned raster files of analog map
 
How to choose a good raster data
1. Having a clear reference coordinate
2. It has a scale
3. Having clear boundaries
4. A clear direction of the wind

- Data tabulation
    a. manual tables: the data in a table that can be used as a reference in making a vector image
    b. GPS: data taken from GPS devices such naviasi

- Data from field measurements
for example, such as data administrative boundaries, forest boundaries, boundaries

Jumat, 28 September 2012

Benefits of GIS


Benefits of GIS in various fields

Benefits of GIS
Add caption
1. Land-use management

     - Know the natural resources, such as petroleum, coal, gold, iron and other minerals.
     - Know the distribution of the land
     - For the monitoring of these natural disasters, such as: an area of ​​natural disaster, the danger level of flooding, erosion and drought

2. For Urban and Regional planning

     - For the resources sector, such as the suitability of land settlement, agriculture, plantation, land use, mining and energy, the analysis of disaster-prone areas.
     - In the field of spatial planning, such as spatial planning, regional planning industry, markets, residential areas, developing system and the status of the defense.
     - For management or infrastructure of an area, such as the management of water supply network information systems, planning and expansion of the electricity network.
     - For the tourism sector, such as inventory and analysis of the tourism potential of tourism in a region.
     - For the transport sector, such as public transport network inventory, compliance alternative routes, expansion of the road network system planning, analysis and kecelakaaan areas prone to congestion.
     - For the social and cultural fields, such as to determine distributions of population and a vast territory, knowing the vast and distribution of agricultural land as well as the possibility of drainage patterns, data collection and the development of centers of growth and development in an area, data collection and development of residential areas, industrial areas, schools, hospitals, entertainment facilities and offices.

Scope of GIS


Scope of GIS, consisting of:

scope of gis
Add caption
     1. Input data

Process input data is used to input data spatial and non-spatial Data. Spatial data is data that has references room kebumianadn have spatial attributes (spatial) usually in the form of analog maps.

     2. Data manipulation

GIS is able to perform edit functions for spatial data and non-spatial.

     3. Data management

Data that has been processed will be stored in a database or DBMS.

     4. Query and Analysis

Query is the tabular analysis is done. In GIS can perform two types of analysis, namely:

         Analysis of Proximity: Proximity analysis is based on the analysis of the geographical distance between the layers.

         Analysis Overlay: Overlay is the process of pooling data from different coating layer.

     5. Visualization

In the end result is a GIS map divisualisaikan in digital or print out

Rabu, 26 September 2012

The main components of GIS


The main components of GIS are

component of GIS
GIS
1. Hardware

GIS Hardware is the physical devices that are part of the computer system that supports the analysis and mapping goegrafi. GIS consists of hardware

     Input data such as mouse, digitizer, scanner, camera
     If the data like a hard drive, processor, RAM, VGA Card
     Output data such as LCD, monitors, plotters, printers, screening.

2. Software

The software used to carry out the process of storing, analyzing, visualizing data both spatial and non-spatial. Are as follows:

     Tool to insert and manipulate GIS data
     Data Base Management System (DBMS)
     Tool to analyze data
     Tools for data display and analysis

3. Data

Consists of two components:

     Spatial Data

Spatial data is a real picture of a region that is on the earth's surface. Generally represented in the form of graphs, maps, pictures with a digital format and stored in the form of the coordinates x, y (vector) or in the form of images (raster) that have a certain value.

     Non-Spatial Data (Attributes)

Non-spatial data is in the form of data tables where the table contains information possessed by objects in the spatial data.

4. Human

Humans are the core elements of the GIS because humans are planners and users of GIS.

5. Method

The method used in GIS will be different for each problem. GIS is good depending on the design aspects and aspects of Real side.

History of GIS


History of GIS

At 35 thousand years ago, it was discovered that the line drawings of animals and is believed to be the animal migration routes. The Cro-Magnon hunter who has described the picture.
history of GIS
History of GIS

In 1700, modern survey techniques have been established. Like the earlier versions of thematic mapping.

Start of the 20th century shows the development of "litogradi photo" layer where the map is separated into layers. Year 1967 was the beginning of the development of GIS is applied in Ottawa, Ontario by the Ministry of Energy, Mines and Resources. Developed by Roger Tomlinson, known CGIS (Canadian GIS), is used to store, analyze and process the data collected for the Canada Land Inventory (CLI - Canadian Land Inventory)

CGIS is the first system in the world and the result of improved mapping application that has crippled the ability of stacking (overlay), counting, pendijitalan / scanning (digitizing / scanning), supporting the national coordinate system that extends over the continental United States. Pengembangya, a geographer named Roger Tomlinson later called the "father of GIS".

CGIS lasted until the 1970's and takes a long time for completion after the initial development, and can not compete mapping applications commercial premises issued several vendors such as Intergraph. The development of micro-computer hardware spur other vendors such as ESRI, Caris, MapInfo. At the end of the 20th century, the rapid growth in various systems to be consolidated and standardized platform less, and users began exporting GIS data display via the Internet, which requires a standard data format and transfer.

Selasa, 25 September 2012

What is GIS?


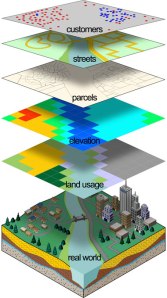
Geographic Information System (GIS) is an information system designed to work with spatially referenced data or berkoordinat geography. In addition, GIS can also combine data, organize the data and perform data analysis that will produce output that can be used as a reference in decision-making on issues related to geography.
What is gis
What is gis
Understanding GIS today is more often applied to the spatial or geographic information technologies oriented to the use of computer technology. The correct combination of the four main components will determine the success of a development project Geographic Information Systems.The main components of Geographic Information Systems can be divided into 4 main components: hardware (digitizer, scanner, Central Procesing Unit (CPU), hard disk, etc.), software (ArcView, Idrisi, ARC / INFO, ILWIS, MapInfo, etc.), organization (management) and user (user).
Geographic Information Systems are divided into two groups: manual systems (analog), and automated systems (digital-based computers). The difference lies in the way of management. Information systems are usually manually merge some data such as maps, transparencies for stacks (overlay), aerial photography, statistical reports and reports of field surveys. All of the data is compiled and analyzed manually. While automated Geographic Information Systems has been using the computer as a data processing system through a digital process.
GIS applications can be used for various purposes for which the data is processed has geographic references, meaning the data is composed of the phenomenon or object that can be presented in a physical form and spatial location (Indrawati, 2002).
The main objective of the use of Geographic Information Systems is to make it easier to get the information that has been processed and stored as an attribute of a location or object. The main characteristic of data that can be used in Geographic Information Systems is the data that has been tied to the location and a basic data that has not been specified (Dulbahri, 1993).
The data are processed in GIS is basically composed of spatial data and attribute data in digital form, so that the analysis can be used is the analysis of spatial and attribute analysis. Spatial data is data relating to the spatial location of the general shape of the map. While attribute data is a data table that serves to explain the existence of various objects as spatial data.
The presentation of spatial data has three basic ways, namely in the form of dots, lines and shapes form area (polygon). The point is a single appearance of a pair of x, y coordinates showing the location of an object such as height, location of the city, the location of the sample and the others. The line is a set of points which form an elongated appearance such as rivers, roads, and other kontus. While the appearance of the area is bounded by a line that forms a homogeneous space, for example: boundary, limit the use of land, islands, and so forth.
Spatial data structure divided into two raster data models and data models vector. Raster data is data that is stored in a rectangular box (grid) / cell, forming an orderly space. Vector data is data that is recorded in the form that displays the coordinates of the point, placing and storing spatial data using point, line or area (polygon) (Barus and Wiradisastra, 2000)